AMD finally matters in the laptop space with their Zen 2 Ryzen 4000 H platform, and not just when it comes to performance in demanding loads, but also with daily use and gaming.
Gaming, in particular, is something the previous Ryzen platforms have struggled with, and that’s changing now.
In this article, we’re pitching the Ryzen 7 4800H mid-level APU in the Ryzen 4000 lineup, gainst the mid-range Intel Core i7-9750H counterpart, which is part of most competitive gaming laptops out there as of mid-2020. Furthermore, we’re throwing in the higher-tier i9-9880H as well, as although a more expensive option, that’s Intel’s 8C/16T tier-match for the Ryzen 7 4800H APU.
We’re also including the Core i5-9300H in our comparison, and that’s because some of you might consider that as well when shopping in the lower-budget, where Core i7 configurations of certain laptops might jump on top of your budget. And that will happen more often taht you’d think, as AMD APUs are generally implemented in lower and mid-tier notebooks, while Intel still gets a broader offer these days.
On the other hand, this article does not discuss the Intel 10th gen Core H processors (i7-10750H, i7-10875H, etc) though, as that’s a topic we’re covering in a separate article once those are out.
With that out of the way, here’s a quick specs sheet of the Ryzen 7 4800H versus the Intel options.
| Ryzen 7 4800H | Core i7-9750H | Core i9-9880H | Core-i5-9300H | |
| Build process | 7 nm | 14 nm | 14 nm | 14 nm |
| Generation | Zen 2 | Coffee Lake | Coffee Lake | Coffee Lake |
| TDP | 45 W | 45 W | 45 W | 45 W |
| Cores/Threads | 8/16 | 6/12 | 8/16 | 4/8 |
| CPU Base Frequency | 2.9 GHz | 2.6 GHz | 2.3 GHz | 2.4 GHz |
| CPU Max Turbo | 4.2 GHz | 4.5 GHz | 4.8 GHz | 4.1 GHz |
| L3 Cache | 8 MB | 12 MB | 16 MB | 8 MB |
| Memory Type |
DDR4 3200 MHz | DDR4 2666 MHz | DDR4 2666 MHz | DDR4 2666 MHz |
| Graphics | Radeon Vega, 8 CUs | Intel UHD 630 | Intel UHD 630 | Intel UHD 630 |
| Graphics Speed | up to 1600 MHz | up to 1150 MHz | up to 1200 MHz | up to 1050 MHz |
| Processing Power | 1.43 TFLOPs | ~.384 TFLOPs | ~.384 TFLOPs | ~.384 TFLOPs |
Of course, AMD and Intel use different platforms with their own particularities. Zen 2 is built on a 7 nm processor though, which allows AMD the higher number of CPUs/thread and frequencies at a lower cost. Furthermore, it’s important to note that Zen2 supports faster memory and includes a far more capable iGPU, but that doesn’t actually matter in real-life, where any of these processors are bundled with some sort dGPU, most likely from Nvidia.
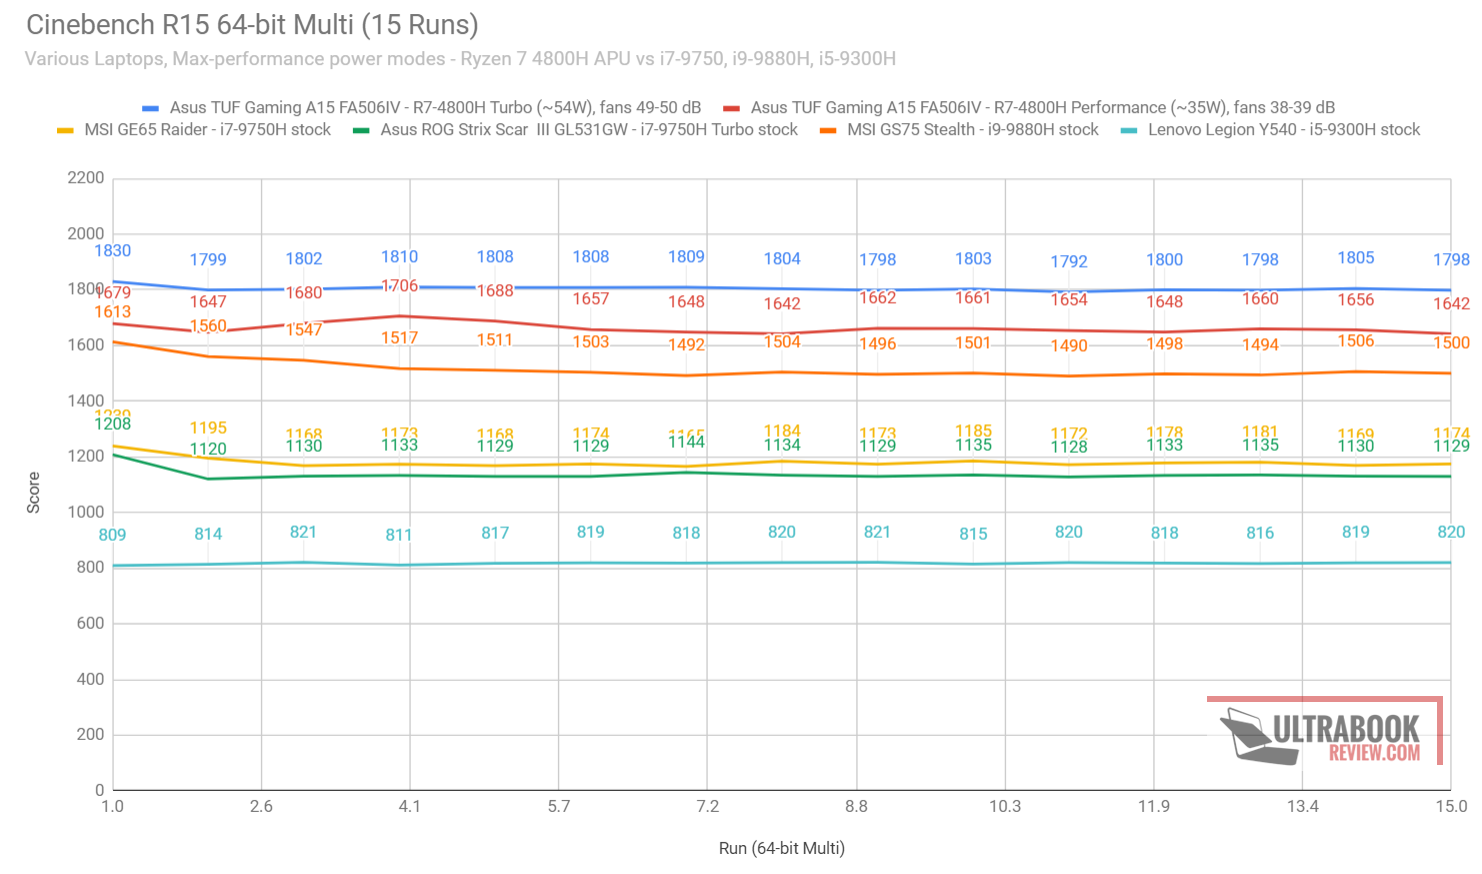
And that brings us to the performance of these platforms. Down below we’re including a bunch of different tests, and we’re starting with our Cinebench R15 multi-loop benchmarks which test the processors’ ability to perform and maintain their performance in longer-term demanding loads. The results we’re including in this article are based on these reviews:
- Asus TUF Gaming FA506IV – Ryzen 7 4800H CPU, RTX 2060 90W OC, 32 GB RAM, 1 TB SSD
- MSI GE65 Raider – Intel Core i7-9750H CPU, RTX 2060 90W OC, 16 GB RAM, 512 GB SSD
- Acer Predator Helios 300 – Intel Core i7-8750H CPU, RTX 2060 80W, 16 GB RAM, 2×512 GB SSD in RAID
- Lenovo Legion Y540 – Intel Core i5-9300H CPU, RTX 2060 80W, 16 GB RAM, 512 GB SSD
- MSI GS75 Stealth – Intel Core i9-9880H CPU, RTX 2080 90W, 32 GB RAM, 1 TB SSD
We did out best to choose matching configurations across the board, but we had to go with the higher-tier model for the i9, as that CPU is most of the time only paired with this sort of graphics.
Keep in mind we’re using the highest performance profiles available in each case, but without including undervolted results for the Intel models, since that’s not also an option for the AMD products. That means you can expect 5-10% higher scores on some of the Intel models, but that’s varying between implementations.
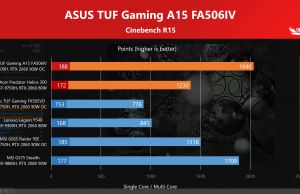
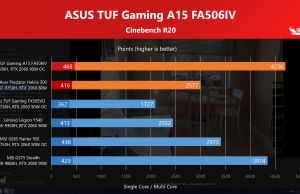
And here’s a quick comparison between the Ryzen 7 4800H and the rest of the Intel Platforms, on their max-performance profiles.
| Ryzen 7 4800H (FA506) |
Core i7-9750H (GE65 Raider) |
Core i7-8750H (Helios 300) |
Core i5-9300H (Legion Y540) |
Core i9-9880H (GS75 Stealth) |
|
| Cinebench R15 CPU | 1846 cb | 1292 cb | 1193 cb | 844 cb | 1668 cb |
| Cinebench R15 Single Core | 188 cb | 185 cb | 173 cb | 169 cb | 195 cb |
| Cinebench R20 CPU | 4236 cb | 2772 cb | 2577 cb | 1941 cb | 3532 cb |
| Cinebench R20 Single Core | 468 cb | 436 cb | 416 cb | 362 cb | 466 cb |
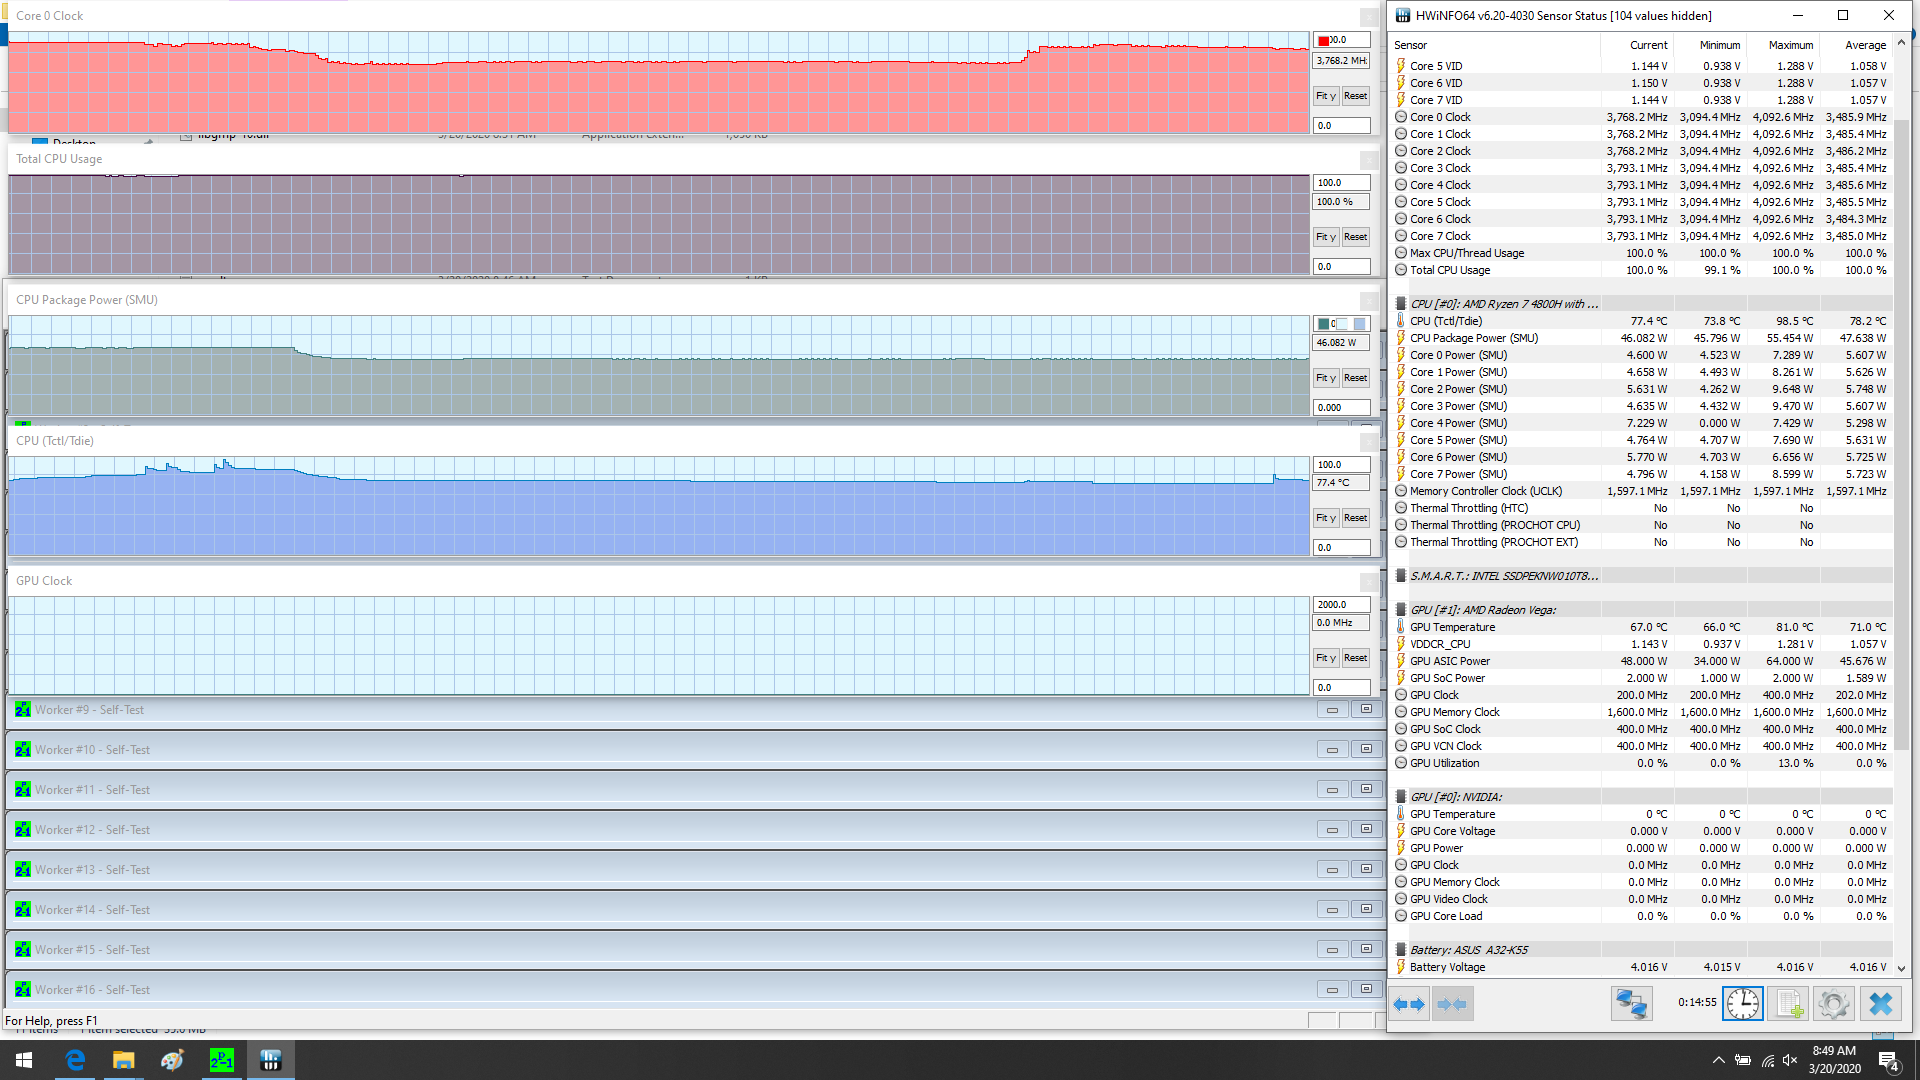
We also ran Prime95 on the TUF Gaming FA506IV 4800H configuration in order to show how the CPU deals with longer 100% loads. It kicks hard at around 54 W, but then settles at 45W after a few minutes, with slight frequency and temperature variations.
Most Intel configurations perform about the same in Prime95, but with exceptions.
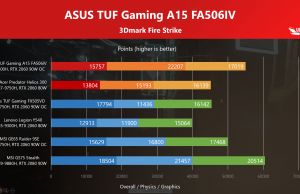
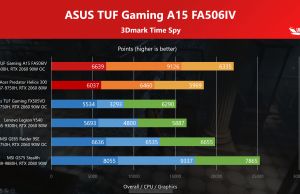
This aside, we also ran a few other benchmarks on the various configurations, including GeekBench, 3DMark, and x265 Bench decoding. All these tests are running on the Turbo/Highest-performance settings.
| Ryzen 7 4800H (FA506) |
Core i7-9750H (GE65 Raider) |
Core i7-8750H (Helios 300) |
Core i5-9300H (Legion Y540) |
Core i9-9880H (GS75 Stealth) |
|
| 3DMark – Fire Strike Physics | 22207 | 16800 | 16139 | 12081 | 21182 |
| 3DMark – Time Spy CPU | 9126 | 6535 | 6460 | 4684 | 8771 |
| Geekbench 4 64-bit – Multi-Core | 30945 | 6535 | 19749 | – | 30440 |
| Geekbench 5 64-bit – Multi-Core | 8294 | 6052 | – | 4327 | 7762 |
| Geekbench 5 64-bit – Single Core | 1195 | 1188 | – | 1100 | 1208 |
| PassMark CPU | 20835 | 15092 | 14619 | 11094 | – |
| PCMark 10 – Productivity | 7443 | 7107 | 7149 | 7052 | 7308 |
| PCMark 10 – Digital Content Creation | 6598 | 7112 | 5250 | 7186 | 7805 |
| x265 HD Benchmark | 33.48 fps | 48.92 fps | 50.22 | 63.98s | 36.45s |
A couple of things to take out of these results:
- First off, the 4800H is about on par with the Intel options in most single-core loads, and outmatches the i5 by 10-15%;
- As far as multi-threaded loads go, the i9-9800H is the only one that comes even close to the R7 4800H, but the AMD APU still comes on top in most tests;
- Compared to the Intel i7s though, the Ryzen 7 is roughly 1.3x faster, due to the improved IPC and higher number of cores/threads.
- Keep in mind that PCMark 10 scores are influenced by the entire configuration, RAM, SSD and GPU, so no concludent for the CPU’s performance alone.
Finally, we should also talk about the gaming experience and thermals. These will vastly vary between implementations, based on graphics and thermal implementations available in each product. However, the fact that we’re comparing fairly similar Asus notebooks helps here.
We’ve added some results down below. Again, there are the configurations we’re looking at:
- Asus TUF Gaming FA506IV – Ryzen 7 4800H CPU, RTX 2060 90W OC, 32 GB RAM, 1 TB SSD
- MSI GE65 Raider – Intel Core i7-9750H CPU, RTX 2060 90W OC, 16 GB RAM, 512 GB SSD
- Acer Predator Helios 300 – Intel Core i7-9750H CPU, RTX 2060 80W, 16 GB RAM, 2×512 GB SSD in RAID
- Lenovo Legion Y540 – Intel Core i5-9300H CPU, RTX 2060 80W, 16 GB RAM, 512 GB SSD
We left the i0880H GS75 Stealth out of this one, since the GPU matters more than the CPU in games, and the RTX 2080 is no match for the 2060s in the others.
| TUF FA506IV | GE65 Raider | Helios 300 | Legion Y540 | |
| Battlefield V (DX 12, Ultra Preset, Ray-Tracing OFF) | – | 80-90 fps | 74-96 fps | 74-88 fps |
| Far Cry 5 (DX 11, Ultra Preset, SMAA) | 91 fps | 98 fps | 84 fps | 84 fps |
| Middle Earth: Shadow of Mordor (DX 11, Ultra Preset) | 147 fps | 123 fps | 142 fps | 114 fps |
| Rise of Tomb Raider (DX 12, Very High Preset, FXAA) | 91 fps | 88 fps | 74 fps | 88 fps |
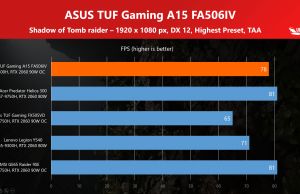
| Shadow of Tomb Raider (DX 12, Highest Preset, TAA) | 78 fps | 81 fps | 71 fps | 74 fps |
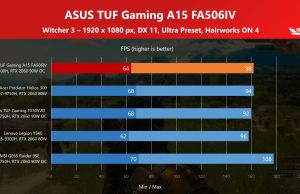
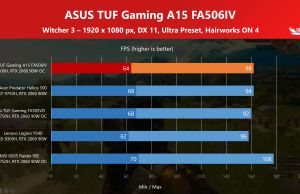
| The Witcher 3: Wild Hunt (DX 11, Ultra Preset, Hairworks On 4) | 64-98 fps | 80-108 fps | 78-94 fps | 62-96 fps |
- The Witcher 3 – recorded with Fraps/in-game FPS counter in campaign mode;
- Far Cry 5, Middle Earth, Strange Brigade, Red Dead Redemption 2, Tomb Raider games – recorded with the included Benchmark utilities;
- Red Dead Redemption 2 Optimized profile based on these settings.
Surprisingly perhaps for some, the AMD Ryzen CPU doesn’t help as much when it comes to gaming. In fact, most of the Intel models are on par of fare better with games, even with the lower power GPU in some cases. And keep in mind Intel notebooks can be further tweaked, by undervolting the CPU and then overclocking the GPU, as you can find from our reviews, and thus end-up outmatching the AMD configuration across the board. Yes, even, the i5-9300H/RTX 2060 80W configuration in the Legion Y540 ends up better in games once tweaked.
There’s no way to tweak the Ryzen 7 APU as of right now, though, and it might not be for a while, since Ryzen Mobile has never been supported by AMD Master in the past. Furthermore, AMD systems tend to run very hot: the CPU averages temperatures in the mid-90s on the TUF Gaming FA506, with the GGPU averaging around 80 C. That leaves very little room to further overclock the GPU.
In comparison, most of the Intel configurations run at lower temperatures, and that allows the GPUs to run at higher clocks, and leave that room for overclocking.
In conclusion, Intel still has the edge over AMD models when it comes to the gaming experience, but with Ryzen 4000, AMD are now a lot closer than they were in the past. Furthermore, part of this is due to the fact that Intel platforms are integrated into higher-tier SKUs with superior thermal designs, such as the GE65 Raider or the ROG Scar. AMD hardware still only makes its way inside entry to mid-level products, such as the Asus TUFs and Acer Nitros, and that influences thermals and thus, the overall gaming experience. For what is worth though, this should hopefully change in the future, as there’s a lot of potential in these Ryzen 4000 H platforms and it’s partially wasted at this lower tier.
On the other hand, AMD mops the floor with most mid-level existing Intel platforms in productivity and multi-threaded loads. However, even this might change, though, with the Intel 10th gen Core H mobile platform, which will include an 8C/16T Core i7 CPU for the first time ever. We’ll talk about that in a future article.









Babe
April 10, 2020 at 5:33 am
Your geekbench Intel is wrong type.
Andrei Girbea
April 10, 2020 at 10:10 am
What do you mean?